Gradient Descent for Logistic Regression

Unlike linear regression, logistic regression does not have a closed-form solution. Instead, we use the generalized linear model approach using gradient descent and maximum likelihood.

First, lets discuss logistic regression. Unlike linear regression, values in logistic regression generally take two forms, log-odds and probability. Log-odds is the value returned when we multiply each term by its coefficient and sum the results. This value can span from -Inf to Inf.

Probability form takes the log-odds form and squishes it to values between 0 and 1. This is important because logistic regression is a binary classification method which returns the probability of an event occurring.

To transform log-odds to a probability we perform the following operation: exp(log-odds) / 1 + exp(log-odds). And to transform probability back to log odds we perform the following operation: log(probability / 1 – probability).


Next, we need to consider our cost function. All generalized linear models have a cost function. For logistic regression, we maximize likelihood. To compute the likelihood of a set of coefficients we perform the following operations: sum(log(probability)) for data points with a true classification of 1 and sum(log(1 – probability)) for data points with a true classification of 0.

Even though we can compute the given cost of a set of parameters, how can we determine which direction will improve our outcome? It turns out we can take the partial derivative for each parameter (b0, b1, … bn) and nudge our parameters into the right direction.


Suppose we have a simple logistic regression model with only two parameters, b0 (the intercept) and b1 (the relationship between x and y). We would compute the gradient of our parameters using the following operations: b0 – rate * sum(probability – class) for the intercept and b1 – rate * sum((probability – class) * x)) for the relationship between x and y.

Note that rate above is the learning rate. A larger learning rate will nudge the coefficients more quickly where a smaller learning rate will approach the coefficients more slowly, but may achieve better estimates.


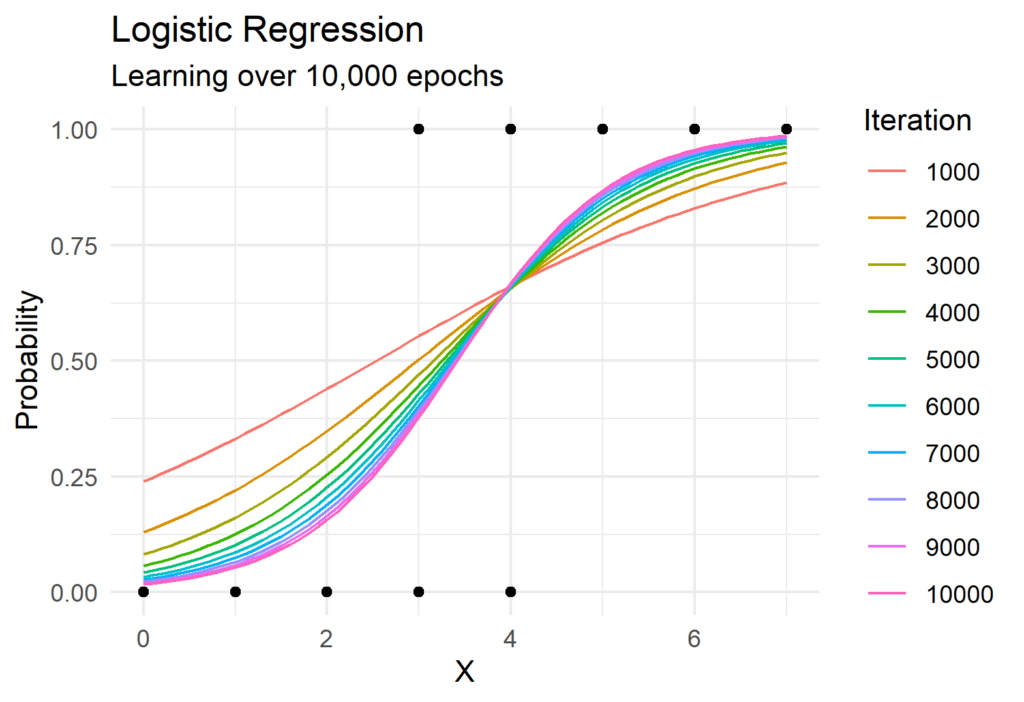
Now lets put all of this together! The Python function to perform gradient descent for logistic regression is surprisingly simple and requires the use of only Numpy. We can see gradient descent in action in the visual below which shows the predicted probabilities for each iteration.

import numpy as np

def descend(x, y, b0, b1, rate):

    # Determine x-betas
    e_xbeta = np.exp(b0 + b1 * x)
    x_probs = e_xbeta / (1 + e_xbeta)
    p_diffs = x_probs - y

    # Find gradient using partial derivative
    b0 = b0 - (rate * sum(p_diffs))
    b1 = b1 - (rate * sum(p_diffs * x))
    return b0, b1


def learn(x, y, rate=0.001, epoch=1e4):

    # Initial conditions
    b0 = 0 # Starting b0
    b1 = 0 # Starting b1
    epoch = int(epoch)

    # Arrays for coefficient history
    b0_hist = np.zeros(epoch)
    b1_hist = np.zeros(epoch)

    # Iterate over epochs
    for i in range(epoch):
        b0, b1 = descend(x, y, b0, b1, rate)
        b0_hist[i] = b0
        b1_hist[i] = b1

    # Returns history of parameters
    return b0_hist, b1_hist

# Data for train
x = np.array([0, 1, 2, 3, 4, 3, 4, 5, 6, 7])
y = np.array([0, 0, 0, 0, 0, 1, 1, 1, 1, 1])

# Generate model
b0_hist, b1_hist = learn(x, y)

Kahan’s Summation Algorithm: Computing Better Sums

Suppose you have the following list of numbers in Python and you would like to compute the sum. You use the sum() function and expect it to return 0.3. Yet, when you run the code the console returns a value very slightly above 0.3:

numbers = [0.1, 0.1, 0.1]

sum(numbers)

0.30000000000000004

You can round this number of course, but it begs the question as to why the correct sum was not returned in the first place. Enter the IEEE 754 floating point standard.

Floating Point Storage

The double type is a 64 binary digit (bit) numerical storage standard that includes 1 sign bit (determines if number is positive or negative), a 53 bit significand (only 52 are stored for non-zero values), and an 11 bit exponent.

An 11 bit exponent means the smallest positive number that can be stored is 2-1022. Additionally, the largest rounding error possible in this standard is 2-52 called machine epsilon. Because this is a binary representation that means numbers that can be represented exactly in base 10 must be approximated when converting to binary.

Going back to our example above, 0.1 is a value that must be rounded for storage in this format. This is because 0.1 in binary is infinite:

0.000110011001100110011...

There are methods to store values exactly but this comes at the speed of computation. What if we want to keep the speed of 64 bit computation but reduce our error, specifically for large number series?

The Algorithm

Enter Kahan’s Summation Algorithm. Developed by William Kahan, this summation methodology allows for more accurate summation using the double storage format. Here is a simple Python implementation:

def kahan_sum(x):
   
  sum = 0.0
  c = 0.0
 
  for i in x:
    y = i - c
    t = sum + y
    c = t - sum - y
    sum = t
 
  return sum

Okay, so this looks pretty simple. But what do each of the pieces mean? The first two lines establish a function in Python while setting the starting sum and starting error to 0.0:

def kahan_sum(x):
   
  sum = 0.0
  c = 0.0

The next few lines are the for loop that iterates over each number in the list. First, any error is subtracted from the previous iteration.

y = i - c

Second, the new number is added to the running total minus any error.

t = sum + y

Third, error from this new addition is determined and the new total is assigned. This repeats until there are no more numbers.

c = t - sum - y
sum = t

A Practical Example

Okay, so the code is pretty simple but how does this work in practice? Suppose we have a list of two numbers:

[1.0, 1.0]

Step 1

The sum and error terms are set to 0.0 when the algorithm is started. The first step of each iteration is to take the current value and subtract any error from the previous iteration. Because the starting error is 0.0, we subtract 0.0 from the first value.

1.0 - 0.0 = 1.0

Step 2

Next we add the result of the previous operation to the total. Again, the initial total is 0.0 so we just add 0.0 to the value from Step 1 (1.0). Oh no! The computer had to make a rounding error. In this case, the computer was off by 0.1. We can handle this error in the next steps.

0.0 + 1.0 ~ 1.1

Step 3

In this step we determine the error from Step 2. We take the sum from Step 2 (1.1), subtract the total (0.0), and subtract the total from Step 1 (1.0). This leaves us with the approximate error.

1.1 - 0.0 - 1.0 ~ 0.1

Step 4

Finally, we record the current total for the next iteration!

1.1

And Repeat!

Now we repeat Steps 1, 2, 3, and 4 for each additional number. The difference this time is that we have non-zero values for the error and total terms. First, we subtract the error term from the last iteration to the new value:

1.0 - 0.1 = 0.9

Next, add the new value to the previous total:

1.1 + 0.9 = 2.0

Next, take the sum from the last step and subtract the previous iteration’s total and the value from the first step to estimate any error. In this case there is no error so we record a value of 0.0 for the error going into the next iteration:

2.0 - 1.1 - 0.9 = 0.0

Finally, return the sum. We can see that even though the computer made an error of 0.1, the algorithm corrected itself and returned the correct value:

2.0

Final Thoughts

Kahan’s method of summation strikes a balance between the speed of floating point arithmetic and accuracy. Hopefully this walkthrough makes the algorithm more approachable.

Implementing Fuzzy Matching in Python

Text is all around us; essays, articles, legal documents, text messages, and news headlines are consistently present in our daily lives. This abundance of text provides ample opportunities to analyze unstructured data.


Imagine you are playing a game where someone hands you a index card with the misspelled name of a popular musician. In addition, you have a book containing correctly spelled names of popular musicians. The goal is for you to return the correct spelling of the misspelled name.

In this example, suppose someone hands you a card with “Billie Jole” written on it. You quickly open the book of musicians, find names beginning with the letter B, and find the name “Billy Joel.”

As a human, this was easy for you to complete, but what if you wanted to automate this task? This can be done using Fuzzy Logic, or more specifically, the Levenshtein distance.


The Levenshtein distance considers two pieces of text and determines the minimum number of changes required to convert one string into another. You can utilize this logic to find the closest match to any given piece of text.

I am going to focus on implementing the mechanics of finding a Levenshtein distance in Python rather than the math that makes it possible. There are many resources on YouTube which explain how the Levenshtein distance is calculated.


First, import numpy and define a function. I called the function lv as shorthand for Levenshtein distance. Our function requires two input strings which are used to create a 2D matrix that is one greater than the length of each string.

def ld(s1, s2):    
    rows = len(s1)+1
    cols = len(s2)+1
    dist = np.zeros([rows,cols])

If you were to use the strings “pear” and “peach” in this instance, the function should create a 5 by 6 matrix filled with zeros.

A matrix of zeros.

Next, the first row and column need to count up from zero. Using for loops, we can iterate over the selected values. Our Python function now creates the following matrix.

def ld(s1, s2):
    rows = len(s1)+1
    cols = len(s2)+1
    dist = np.zeros([rows,cols])
    
    for i in range(1, rows):
        dist[i][0] = i
    for i in range(1, cols):
        dist[0][i] = i
A matrix set up for finding the Levenshtein distance.

Finally, we need to iterate over every column and row combination. By doing this, we can find the minimum value of the cells directly above, to the left, and above to the left of each cell. After the minimum is found, our Python script adds one to this value to the location in question.

def ld(s1, s2):
    rows = len(s1)+1
    cols = len(s2)+1
    dist = np.zeros([rows,cols])
    
    for i in range(1, rows):
        dist[i][0] = i
    for i in range(1, cols):
        dist[0][i] = i
        
    for col in range(1, cols):
        for row in range(1, rows):
            if s1[row-1] == s2[col-1]:
                cost = 0
            else:
                cost = 1
            dist[row][col] = min(dist[row-1][col] + 1,
                                 dist[row][col-1] + 1,      
                                 dist[row-1][col-1] + cost)
            return dist[-1][-1]

Our matrix should now look like the following with the far bottom right cell representing the number of changes required to convert one string into another. In this instance, it requires 2 changes to convert “peach” into “pear”; deleting the letter “c” in “peach” and replacing the letter “h” with the letter “r”.

A completed Levenshtein distance matrix. The bottom right number (in gold) represents the number of changes required.

What is so great about this function is that it is adaptable and will accept a string of any length to compute the number of changes required. While the mechanics behind this function are relatively simple, its use cases are vast.